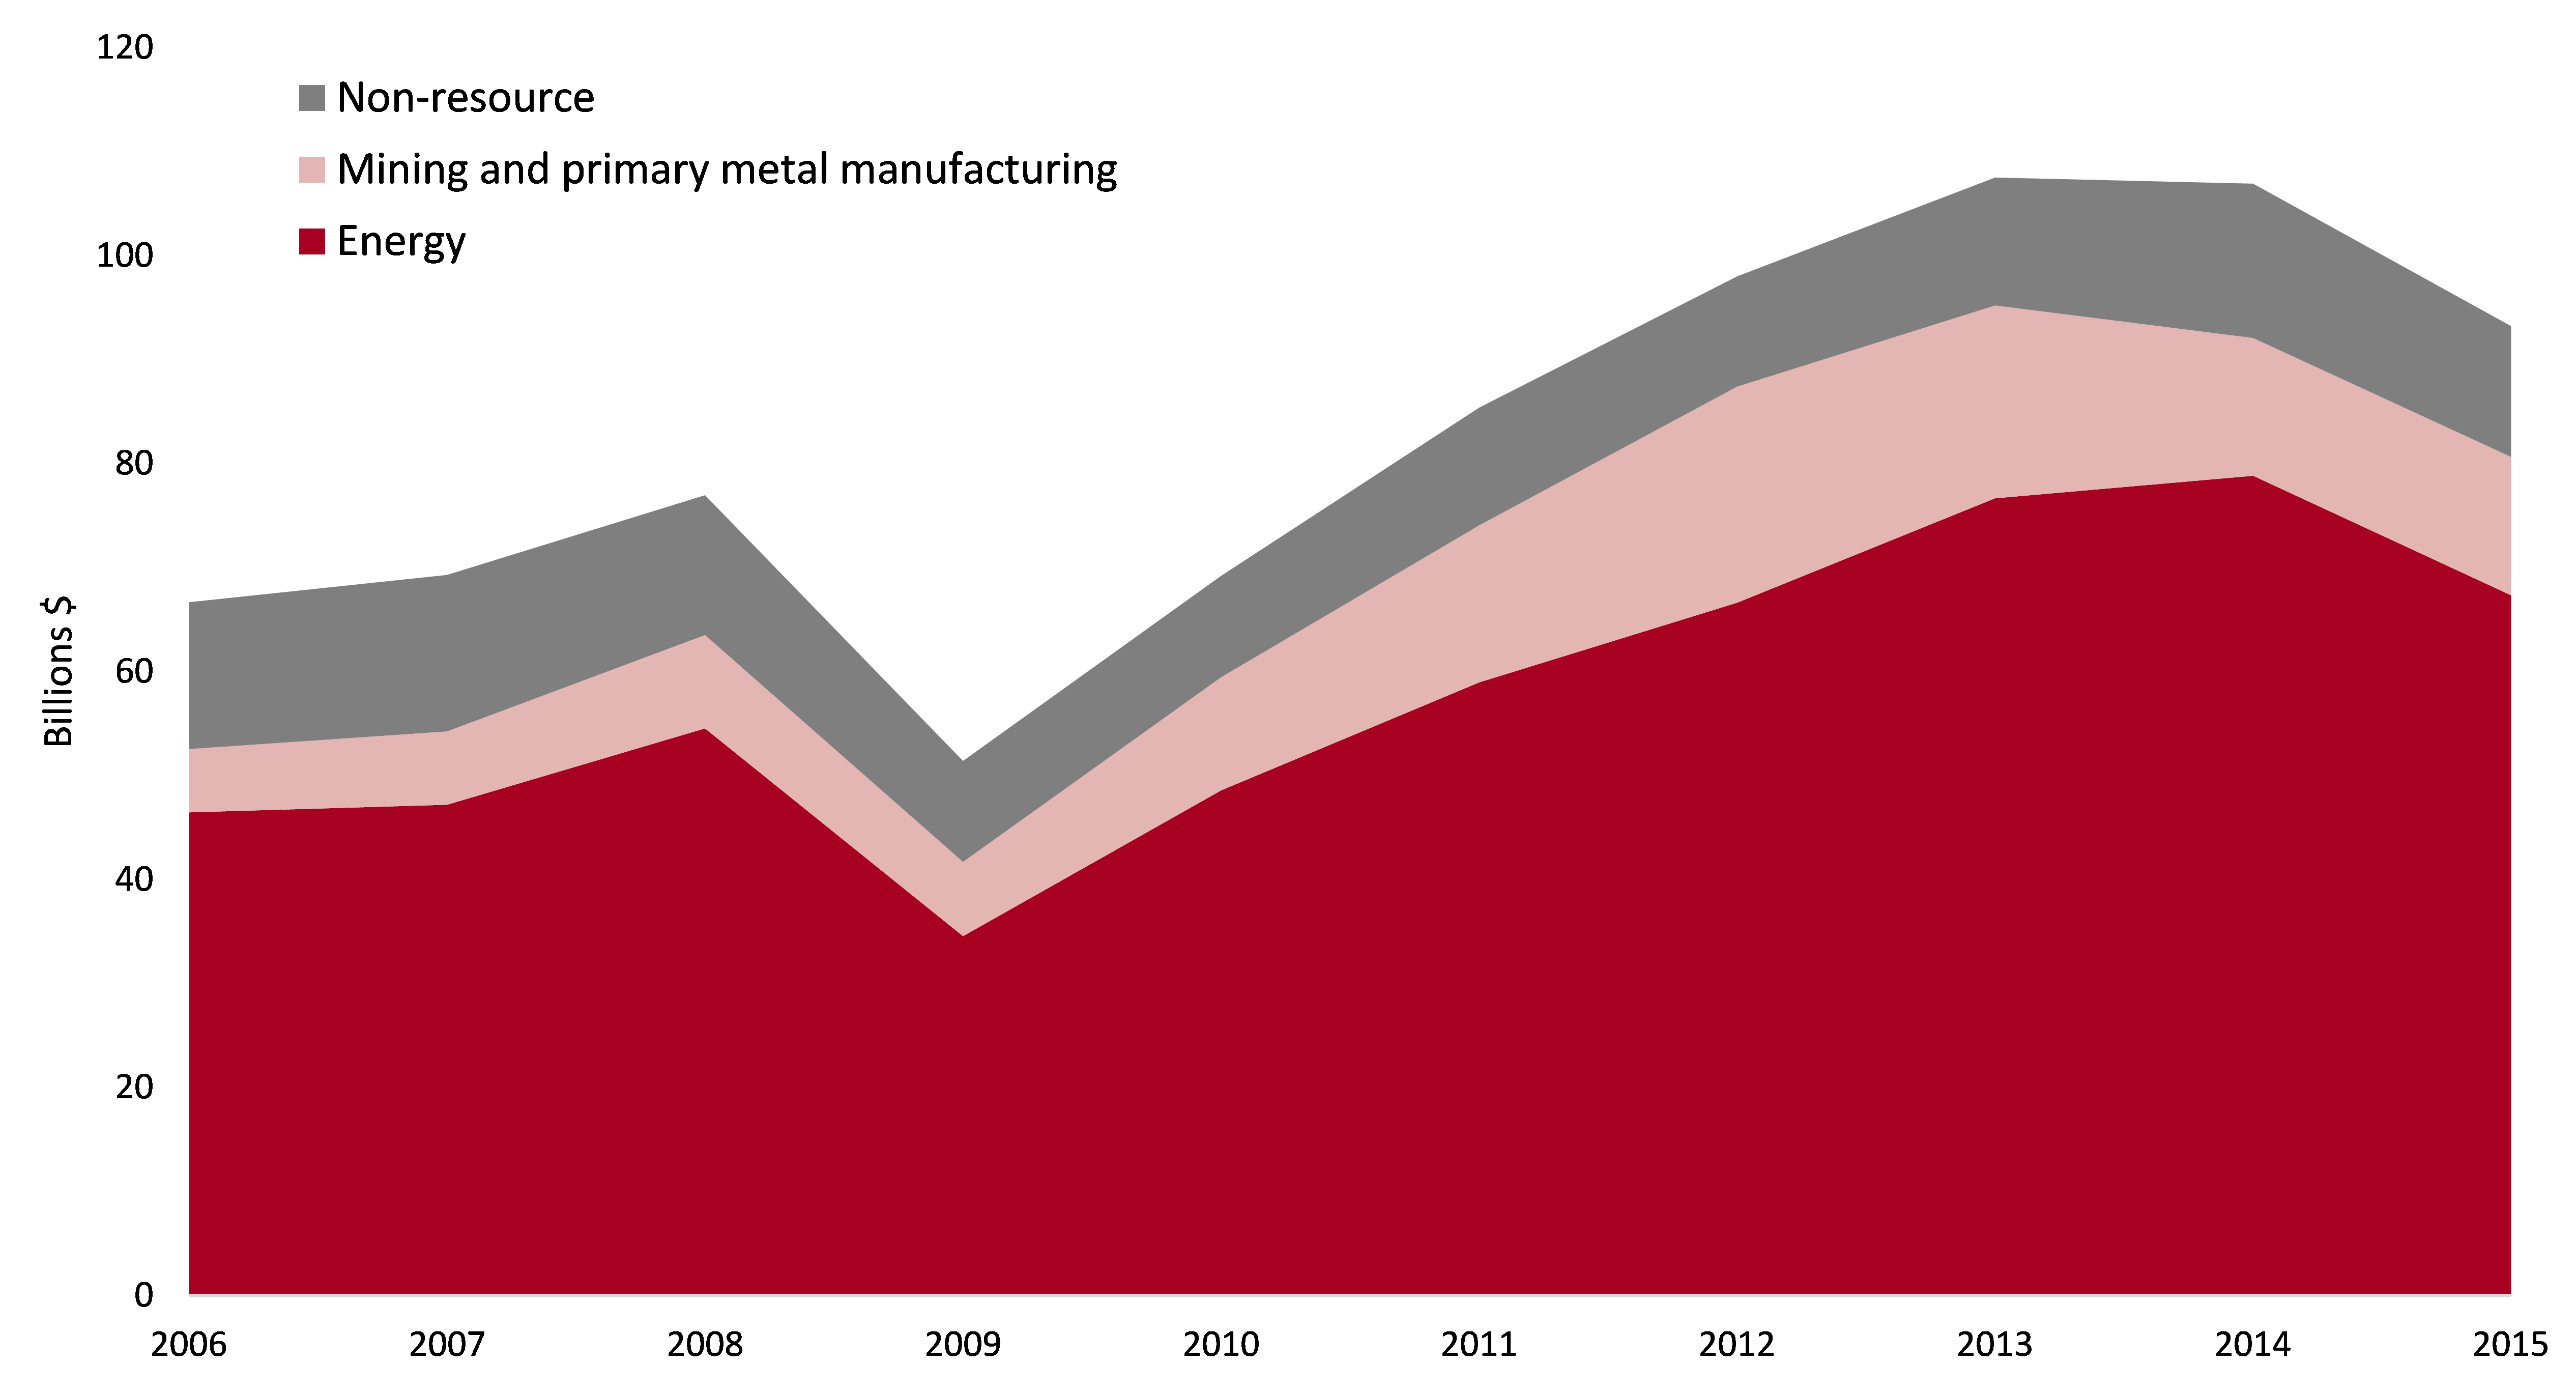
Factors of Economic RecoveryAny Hope from Canadian Corporations? Don’t Hold your Breath A decline in industrial investments (-13% since the 2013 peak), no export growth (-1% since 2014) despite a favorable exchange rate, and increasing overcapacity in office buildings (10% in 2015): from the corporate side, it is difficult to find signs of a real recovery in the Canadian economy based on the most recent indicators. The 2015 technical recession in Canada was short-lived1, but there is a long way to go before one can talk about recovery. Who will boost future economic growth in Canada? Let’s start with corporations. Industrial sector: marked slowdown in investment Mineral prices started to fall in 2011, followed by oil prices in June 2014. Since minerals and hydrocarbons were the source of 70% of industrial investment on average between 2009 and 2015, the sector as a whole saw its investments decrease by 13% from the 2013 peak. Even non-resource industrial investments have slowed, hit by the higher cost of importing equipment (impact of the Can/US exchange rate), as well as constantly diminished international growth prospects. Industrial Capital Expenditures by Sector Source: Statistics Canada. Table 029-0046 – NAICS 21-31-32-33, current dollars. Industrial investment will definitely not spearhead an economic recovery but there is no collapse either. So far, production capacity shutdowns have remained few and far between, and investment levels in 2015 were indeed higher than the average of the last ten years2. A rebound is nevertheless highly unlikely even in the medium term: a review of the status of the largest industrial investment projects in Canada as of December 2015 suggests that almost 60% of these projects (by value) will be commissioned later than expected, if they are not suspended outright3. Some of the projects that have already been started are proceeding with construction, but the across-the-board rush for megaprojects has slowed considerably. Disappointing exports Exports of goods, which had begun to gain momentum in 20144 and had finally surpassed pre-2008 crisis levels, dipped slightly in 2015 (-1% since 2014)5. Non-energy exports did increase, particularly since the exchange rate began to fall in 20136, but not enough to offset the downturn in energy exports7. Meanwhile, the value of goods import continues to rise, now exceeding the value of exports (2015)8. Commercial sector: investments on life support? On the commercial side, the latest government data show that the best years appear to be behind us, especially for the sector’s driving forces – office buildings, shopping centres and hotels/restaurants9 – which peaked in 2008-2009. Though activity shows few signs of slowing down, partly due to irresistible interest rates and an influx of foreign buyers10, one may wonder if current investments are in fact aggravating an overcapacity situation. This is especially the case in the office buildings sector, where vacancy rates are reaching levels that have not been seen since before the financial crisis (10% in 2015)11. So where will growth come from? This overview of the corporate perspective is rather disappointing. Knowing that the combined value of goods and service exports and of business investment12 represents about 50% of GDP13, one might fear that economic growth might be stifled14. Which economic agent could pick up the slack? The Consumer? The State? To be continued… ******
[1] Negative GDP growth in Q1 and Q2 of 2015 in terms of expenditures at market prices. The recovery in Q3 was marked by 0.6% growth. Source: Statistics Canada. Table 380-0064.
|
E&B Data
Economic and Business Data